Real-time Nutrition Optimizer UI

I recently worked on creating such a UI for a Python-based genetic nutrition optimizer project. The goal was a web application where users could set optimization parameters, run the Python script via a Flask backend, and observe the optimization progress live through WebSockets (SocketIO).
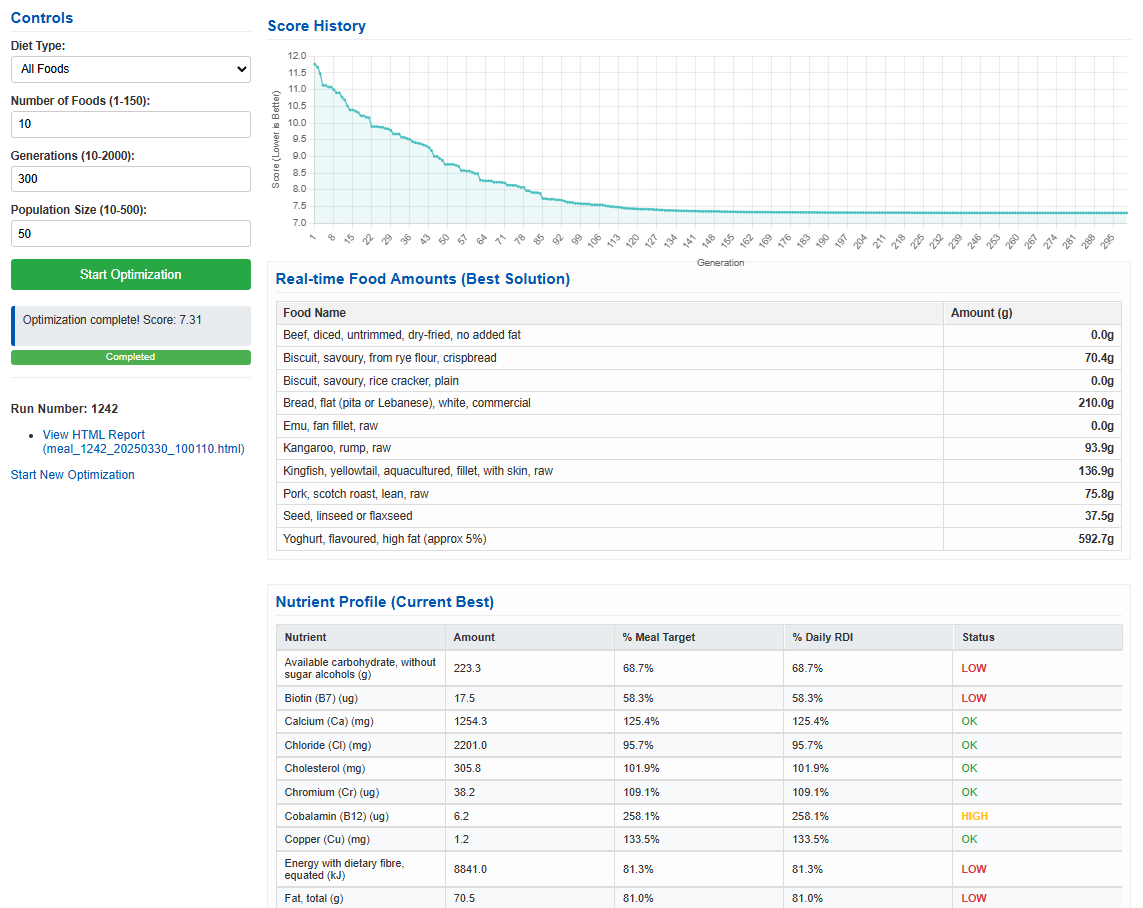
Here’s what the resulting UI looks like :
You can test out the application here :
https://optimize-nutrition.onrender.com/
My initial approach involved using Claude 3.7 to help generate the necessary JavaScript code for the frontend. The core requirements included displaying user controls, a status/progress indicator, a dynamically updating chart showing the optimization score over generations, a table listing the foods in the current best solution, and another detailed table showing the corresponding micronutrient levels – all updating with each generation reported by the backend. However, integrating the asynchronous updates from SocketIO to reliably refresh all these components simultaneously proved difficult. I encountered issues synchronizing the updates across the chart and multiple tables based on the data streamed from the backend, preventing me from achieving a fully functional and stable UI despite various attempts.
As a next step in the development process, I decided to use Google’s new Gemini 2.5 Pro Experimental model with the same set of requirements and my existing Python backend code (Flask, SocketIO, and the optimization logic). I provided the model with the context of the project, the Python code structure, and the specific frontend requirements, including the need for simultaneous updates to the chart and both tables based on the generation_update event emitted by SocketIO. This approach yielded functional JavaScript code that successfully integrated with the backend.
The key code improvements primarily involved structuring the frontend JavaScript to handle the SocketIO events effectively. The generated code established clear listeners for different backend events (status_update, initial_foods, generation_update, optimization_complete, etc.). Crucially, the handler for the generation_update event was designed to parse all relevant data sent from the backend in that single event (current generation number, score, food amounts, and detailed nutrient profile) and then proceed to update all corresponding UI elements: the progress bar, the score chart, the food amounts table, and the nutrient profile table. For the dynamic tables, the logic included clearing the existing table body (tbody.innerHTML = '') before iterating through the new data for the current generation and appending the updated rows (<tr>) and cells (<td>). Gemini 2.5 Pro Experimental also provided the necessary HTML table structures and basic CSS for layout and features like scrollable tables with sticky headers.
For users interacting with the resulting web UI, here’s a breakdown of what you’ll see:
- Controls: Input fields allow setting parameters like Diet Type, Number of Foods, Generations, and Population Size before starting the optimization.
- Status & Progress: A status bar displays messages from the backend (e.g., “Running Generation X/Y”), and a progress bar fills based on the generation count.
- Score History Chart: This line graph tracks the optimization’s performance. The horizontal axis (X-axis) represents the generation number, while the vertical axis (Y-axis) shows the ‘Score’ of the best solution found in that generation. A lower score indicates a better nutritional match to the targets, so ideally, this line should trend downwards as the optimization progresses.
- Real-time Food Amounts Table: This table lists the specific foods and their corresponding amounts (in grams) that make up the best meal plan found in the most recent generation reported.
- Nutrient Profile Table: This detailed table complements the food list. It shows the calculated nutritional breakdown for the current best meal plan listed above. For each nutrient, it displays the total calculated ‘Amount’ (with units), the percentage of the target for that specific meal (‘% Meal Target’), the percentage of the total recommended daily intake (‘% Daily RDI’), and a ‘Status’ indicator (typically LOW, OK, or HIGH based on the meal target percentage). Both the food amounts and nutrient profile tables update simultaneously with each generation update.
This resulting interface now provides the intended real-time feedback, allowing observation of how the genetic algorithm refines the meal plan and its nutritional profile over successive generations.